Introduction: the Imageun research project
The construction of the "IMAGEUN Student Survey" database presented in this article was produced as part of the Franco-German ANR-DFG IMAGEUN research project “In the Mirror of the European Neighbourhood (Policy): Mapping Macro-Regional Imaginations” (2020-2024). Supported by the Collège international des sciences territoriales (CIST) on the French side and the Goethe-Universität Frankfurt am Main on the German side, it involves eleven research teams and universities based in Germany, France, Ireland, Tunisia and Turkey. The aim of the project is to study what are known as ‘macro-regional imaginaries’, in other words practices, representations and discourses relating to geographical areas between the national and global levels. We analyze how they evolve, drawing on their spatial, representational, discursive, material and tangible dimensions (Rouland, Toureille, 2021), from the fields of political geography, critical geopolitics, geography of representations, theoretical and quantitative geography. The research project focuses on the relationships between the macro-regions of ‘Europe’ and the ‘EU’ and the macro-regional entities at play in the imaginations of all the areas surveyed. Here, we understand imaginaries as social and political constructs (Anderson, 1983; Murphy, 2013; Paasi, 2010), produced by practices and representations of these entities over time and at all levels, both top-down (by institutional entities, mobilized in public policies and geopolitical relations) and bottom-up (practiced, represented and appropriated by individuals and collectives) (Escudé-Joffres, 2025; Mareï, Richard, 2020). They convey both the spaces of experience and the horizons of expectation for those spaces (von Hirschhausen, 2023). In all cases, studying macro-regional imaginaries also means studying identities, whether imposed, constrained, or claimed and performed (Avanza, Laferté, 2005; Blais, 2009; Brubaker, 2001; Gilmartin, 2008). The aim is to analyze the ways in which macro-regions are mobilized in the imagination, as a political tool or as an object of projection, and in particular the ways in which Europe and the EU are questioned, articulated and thought about in relation to other nearby macro-regional entities (political, institutional, geographical, cultural, etc.). In order to analyze the imaginaries associated with regions of the world (Asia, the Caribbean, Europe, etc.), the project is being carried out in five countries (Germany, France, Ireland, Tunisia and Turkey) and is structured around three axes based on practices and representations mobilized by specific actors: media, political decision-makers, and students.
Questioning students' spatial imaginations
The "IMAGEUN Student survey" is based on the third axis. Its main objective is to study students' macro-regional imaginaries by analyzing their individual and collective practices and representations (Bronner, 2018; Dernat et al., 2018). Students are a frequently surveyed public for understanding practices and representations in political geography (geopolitics) because they allow for bottom-up questioning of objects and processes (Alves Brasil, Cabecinhas, 2019; Beauguitte, Didelon, Grasland, 2012; Toureille, 2017). Their imaginations incorporate the long term of social representations, but also a heightened sensitivity to change, at a stage of their lives where they are in the process of building their plans (personal, professional, mobility, family, etc.) (Toureille, 2017). As producers of tomorrow's imaginations, they form an easily identifiable, locatable and socially situated group in each national context addressed. They are in fact a socially situated group within the youth population, having benefited from sufficient capital to consider more or less lengthy higher education studies. It is also necessary to emphasize the great heterogeneity within this group in the same national context, but also between them. In each case, students' trajectories are diverse, subject to multiple inequalities. Students find themselves at the intersection of several institutional spheres in which they appear to be a prized political issue, subject to policies designed to attract them, but also to multiple injunctions to mobility, return or even forced orientation, which reproduce social, ethno-racial or gender inequalities and discrimination (Aouani, Orange, Renard, 2019; Ballatore, Blöss, 2008; Frouillou, Moulin, 2019; Lemêtre, Orange, 2016). This population therefore provides an insight into the ways in which descending (institutional) geographical imaginaries are represented, practiced and, above all, appropriated by students through the prism of ascending logics: in other words, how do students mobilize, reject or rethink the geographical imaginaries associated with them?
Considering students' geographical imaginaries on a macro-regional scale as political, historical, social and cultural constructs as well as their complex and fuzzy nature (De Ruffray, 2007), the idea is to analyze the semantic and spatial definitions of macro-regions and their possible relationships from the point of view of a survey population made up of students.
Construction of a numeric mental maps survey
The questionnaire survey that we have built follows on from work on spatial practices and representations at small scales: EuroBroadMap on the representations of Europe and the world in forty-three cities in eighteen countries (Beauguitte et al., 2012; Brennetot, Emsellem, Guérin-Pace, Garnier, 2013), the "Europe in the world" project on the representations of Europe by researchers and policy-makers in the field of European spatial planning involved in the ESPON program (Bachmann, 2015; Didelon, 2010), GlocalMap on the representations of territorial networking in France by its citizens (Grasland et al., 2019), and work on the representations of Europe and the world by Turkish students (Toureille, 2017). This research uses questionnaire surveys that include the creation of mental maps (Gould, White, 1974) to collect elements of spatial representations in graphic form (drawing, outlining, locating).
The mental map as a survey tool occupies an original and relatively old place in the social sciences and in geography methods for analyzing socio-spatial representations in graphic form (Sudas, Gotken, 2012). Originating in behavioral psychology, they were popularized by the architect Kevin Lynch (1960) and introduced into geography by spatial behaviorism (Gould, White, 1974). Here, we use Etienne Toureille's definition of mental maps as ‘subjective representations, through a graphic language (drawing), of a spatial reality by an individual or group of individuals’ (Toureille, 2016, 2017, p. 126). Mental maps provide access to the imaginations and representations of space as it is imagined and constructed by internalized, experienced and socially situated knowledge (Cauvin, 1999). There are three types of mental maps: cognitive maps dealing with unmapped spatial knowledge (Dias, Ramadier, 2017), sketch maps that analyze individual representations of space through a blank page (Battersby, Montello, 2009; Pinheiro, 1998; Saarinen, 1988), and so-called ‘interpretive’ maps that aim to understand the relationship between real space and interpreted space (Didelon, de Ruffray, Boquet, Lambert, 2011). Often used to understand fine scales, research has adapted these methods for small scales such as the world or macro-regions (Beauguitte et al., 2012; Didelon-Loiseau, Emsellem, de Ruffray, 2019; Saarinen, 1988; Sudas, Gotken, 2012; Toureille, 2017).
As part of the ANR-DFG Student Survey, the aim was to strike a balance between sketch maps, which are extremely rich but tend to cause difficulties for respondents and pose interpretation challenges and interpretive maps. It was therefore necessary to aim for a certain degree of standardization in the exercise, moreover considering the diversity of contexts in which the survey was distributed and the issues of comparability and cross-analysis.
The innovation proposed as part of the IMAGEUN Student survey was to adapt this methodology, initially developed on paper (printed questionnaires incorporating one or more map backgrounds), by implementing it on a numeric medium. This enabled the survey to be quickly and massively distributed online, in order to meet the constraints of the Covid-19 pandemic (2019-2020), and also to collect geographical information directly digitized by respondents.
This article reviews the design of the questionnaire and the survey methodology. The processing and enhancements made to the collected data are then briefly explained, before detailing the delivered database and its access conditions.
In order to enable the reuse of the data from this survey and the methodology used, this datapaper is supplemented by a website, linked to the database provided, accessible through this link: https://imageun.gitpages.huma-num.fr/datapaper/. The datapaper is a summary version of the processing and handling of the database (detailed step by step on the website) (Marveaux, Dabestani, Pécout, 2024a), and it is enriched with regard to the methodological issues involved in using numeric mental maps to understand subjective spatial objects.
Survey Methodology for Studying Geographical Imaginaries
The survey has two objectives. The first is to collect the broadest possible overview of geographical imaginaries in each context. The second objective is methodological, and aims to analyze ways of understanding and objectifying vague and subjective geographical objects using a questionnaire involving a numeric mental map exercise. In this section, we present the process of constructing the numeric mapping questionnaire, which is both a contribution and an objective of this survey. We detail the ways in which the tool was used to collect students' macro-regional representations and practices in their broadest possible spectrum. Given the health context of Covid-19, it was difficult to achieve representativeness of the general population or the subpopulations studied. We also review the choices, constraints and limitations of the survey method used.
1. Designing a Numeric Cartographic Questionnaire
The unprecedented and restrictive situation of the Covid-19 pandemic required us to make major adaptations in order to carry out a survey of thousands of students located in different countries and universities, whose different health instructions evolved throughout the construction and administration of the questionnaire (from November 2021 to June 2022). As the timeframe of the project was not conducive to the development of a tailor-made numeric survey tool, a phase of research and comparative analysis of existing tools was carried out. We opted for a numeric survey tool available on different devices (computers, tablets, smartphones) that complied with European regulations and could be used to collect automatically geo-referenced mental maps. Financial constraints and the cost of human maintenance were also considered in the choice of the tool.
As a result, the IMAGEUN Student survey was built and distributed using the Maptionnaire numeric mapping tool1. This participatory GIS application was created by a Finnish team of researchers and planning professionals to meet collaborative mapping needs (Kahila, Kyttä, 2009). This tool offers all the standard functionalities for constructing a robust numeric survey questionnaire, but also the possibility of having mental maps entered using a "pencil-like" drawing tool on an interactive base map from the OpenStreetMap collaborative geographic database2.
Maptionnaire can be used to retrieve all responses in the form of a text file, including georeferenced geographical data (mental maps), supplied in WKT and JSON format.
2. The Questionnaire
A number of tests have shown that collecting information using mental maps as part of an unsupervised online survey can be unsettling for students, because of the technical aspect or the originality of the response method. We therefore worked on the structure, simplification and comprehensibility of the questionnaire in order to minimize the drop-out rate induced by the original mental map exercise.
The questionnaire comprises seven thematic sections (Figure 1) designed to capture students' practices and representations of macro-regions and to collect data that can be compared with the other thematic areas of the project. Figure 1 shows each slide of the questionnaire given to students. In addition to the introductory, informational, concluding, and acknowledgment sequences, the questionnaire sought to understand both the practices and macro-regional representations of students, without limiting itself to the question of the spatiality of macro-regions. Thus, projections and realized mobilities, linguistic, media and cultural practices are considered as elements contributing to macro-regional imaginaries, in a socio-constructivist approach (Paasi, 2010). Each block represents a page, the corresponding section, its content, or the sorting questions used to adapt the length of the questionnaire as the student progressed, with the aim of making it as short as possible and avoiding dropouts. The questionnaire was self-administered and took between 10 and 25 minutes to complete, depending on the number of conditional sections (follow-up question) answered. Details of each section and a visualization of the complete survey are available on a dedicated website (Marveaux et al., 2024a). It presents the survey design and the process of constructing, processing and analyzing the database produced.
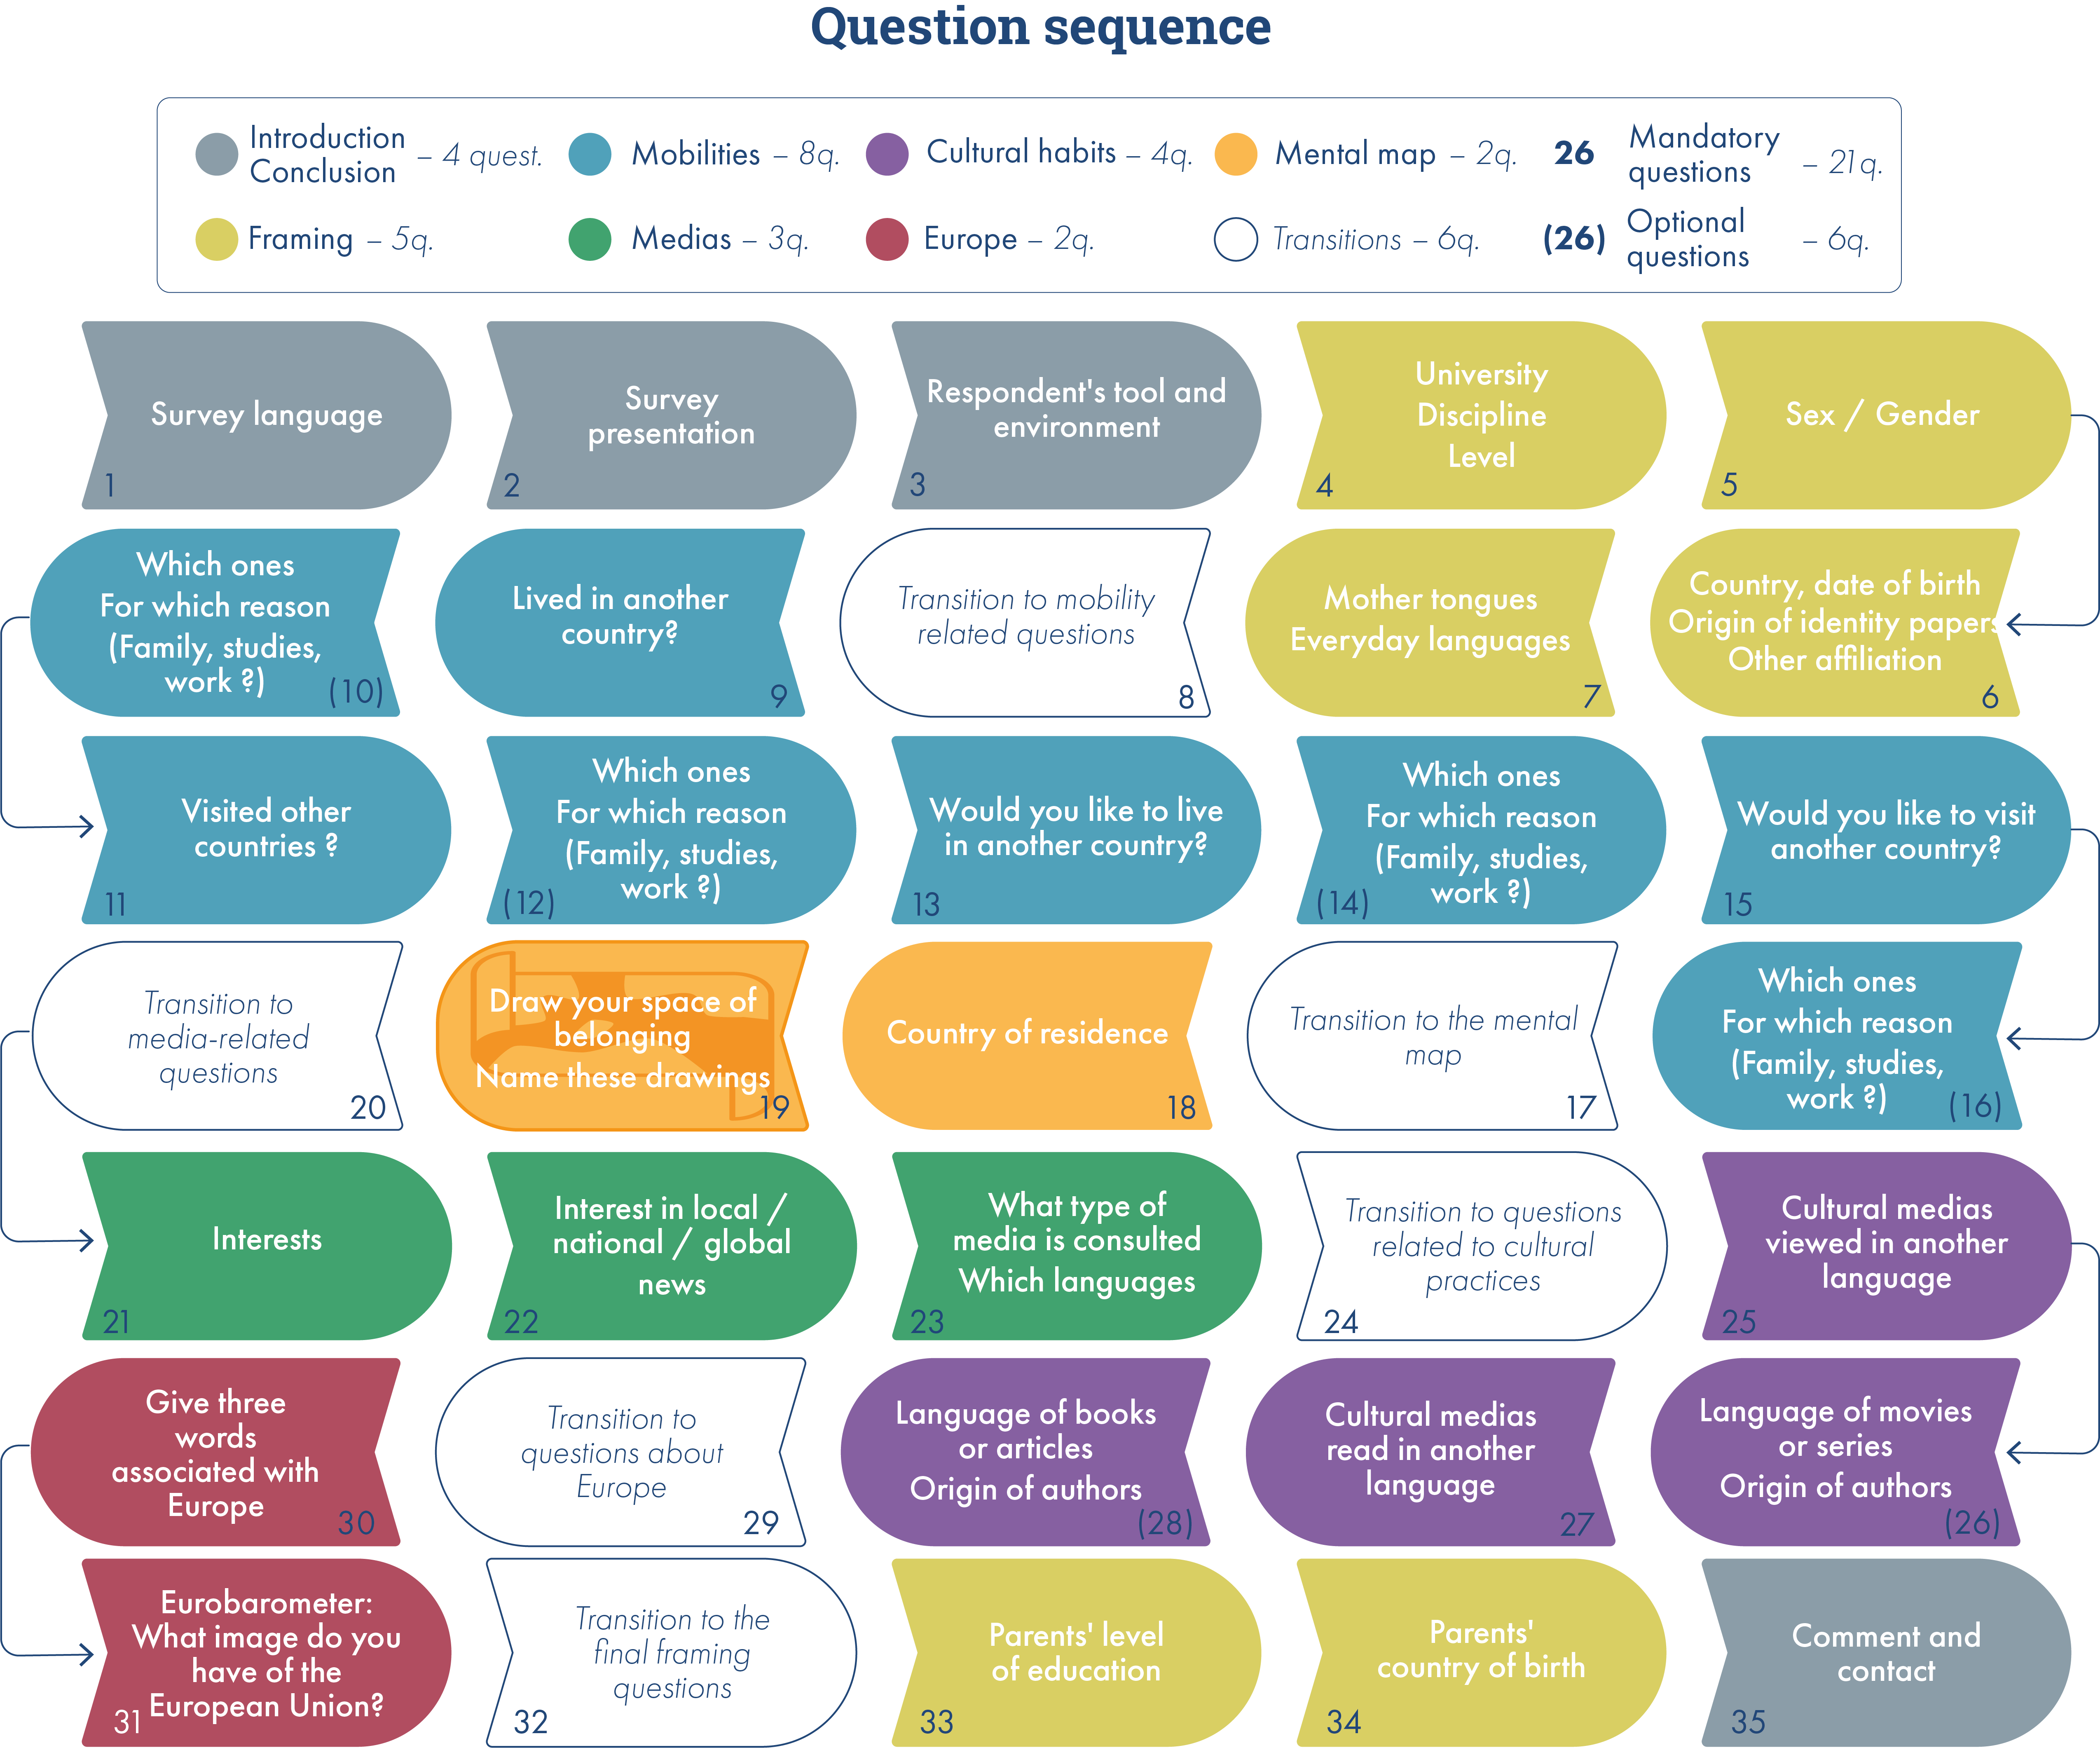
Figure 1: Structure of the IMAGEUN Student Survey Questionnaire
The questionnaire begins with a set of socio-demographic framing questions. Respondents give their spatial background (place of birth, place of residence, country of identity documents), their university status (subject, level, institution), their language practices (languages spoken before the age of five and spoken daily) and their socio-demographic status (age, gender).
Practices and representations of space are introduced in the questionnaire by the section on mobility. We ask students about their actual mobility for professional, personal, academic and tourist purposes. These same categories are then used to ask about their desired mobility. The aim here is to analyze and compare the spaces of actual and desired mobility, and the ways in which these practices and representations help to construct macro-regional representations.
Students are then asked about their spatial representations of macro-regions using a mental map. They are requested to draw and name the region or regions of the world (up to five) in which they are located at the time of completing the questionnaire (Figure 2). The question was broadly worded, allowing several macro-regions to be represented, depending on personal interpretation and understanding of the complexity of spatial affiliations. Technical constraints relating to the Maptionnaire survey tool mean that the choice of an outline excludes other areas. This is why we have maintained the possibility of plotting several spaces in order to consider the complexity, links and spatial logics that emerge between the plotted spaces. The interactivity of the base map also enables respondents to find their way around precisely, thanks to an adaptive generalization (place names, borders, buildings, road network) that depends on the scale (zoom), enabling the map to be adjusted to their mapping needs. The Maptionnaire tool automatically saves the scale used by students to enter the plots, making it possible to carry out interesting analysis. The adaptive base map, showing borders and place names in particular, offered a major advantage in our approach: it did not put students at a disadvantage in terms of their geographical knowledge or their familiarity with using maps. Indeed, one of the main objectives of our specifications for choosing the tool was to avoid giving the impression of a knowledge test, with ‘right’ or ‘wrong’ answers. We are working on a subject that is by definition vague and subjective (macro-regional imaginaries) and on the experiences and practices of students, which are therefore personal and individual. Providing a detailed base map, similar to everyday GPS navigation interfaces, avoided this bias. However, it may have increased the presence of administrative boundaries – state, regional, municipal, etc., depending on the zoom levels chosen by the students – in the drawings produced. In other words, students were able to use them more as reference points in their drawings, and thus guide the placement of certain boundaries.
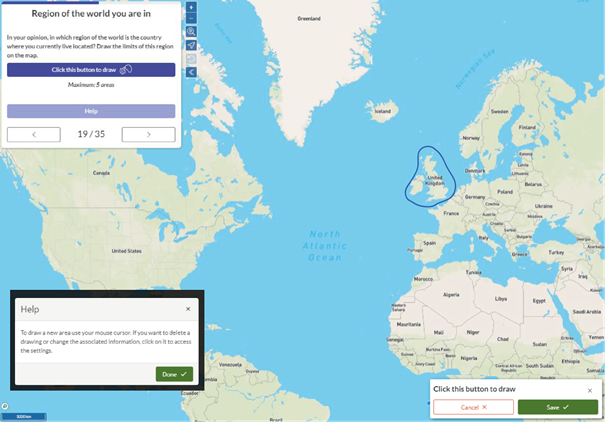
Figure 2: The "Mental Map" Question of the Survey
The objective of the next section, on media practices, is twofold. Firstly, it aims to identify and question the socio-spatial representations arising from students' media practices that are present in macro-regional imaginaries. This involves collecting and analyzing a range of information, such as centers of interest and media consultation languages. This part of the questionnaire is an important methodological aspect for the IMAGEUN project, since it is linked to the "Media" thematic axis.
The set of questions on cultural practices asks about the cultural experiences that help to construct representations of the world and of macro-regions. The questions focus on the origins and languages of the cultural products consulted by the students (videos, series, films or readings), based on the nomenclatures used in the surveys carried out by the French Ministry of Culture3.
As the IMAGEUN project is concerned with the relationship between Europe and the EU in the surveyed countries, the questionnaire also had to include a dedicated section asking students about the position of their region in relation to Europe, based on a question from the European Commission's Eurobarometer survey. This enables us to use a tried and tested formulation, and above all to position our sample of respondents in relation to a large-scale survey carried out over the same period.
Finally, the last part of the questionnaire contains new framing questions that address the socio-spatial parental context of the respondents (parents' country of birth or level of education).
3. The Public Surveyed
Students were surveyed in five countries: Germany, France, Ireland, Tunisia and Turkey. These countries were chosen in order to understand the diversity of attitudes towards the EU and Europe. While mainland France and Germany are part of the EU as an institutional entity and of Europe as a geographical and political continent, the other countries surveyed raise significant issues in their relations with these two entities.
Ireland, a Member State of the EU and part of the European area, questions the relationship between the EU and Europe and non-continental areas, as well as the geopolitical context of Brexit from an Irish perspective. In the case of France, the survey covers mainland France as well as the French overseas departments and regions in the Caribbean, namely Guadeloupe and Martinique. These territories have a very specific position. They are members of the EU with a status dedicated to some of the geographically extra-European territories of EU Member States, in other words, territories that were colonized by European colonial empires and are now associated with the current states4. This status of ‘RUP’ for ‘Région ultrapériphérique’ (‘Outermost region’) is based on an interpretation of ‘ultrapériphéricité’ (‘outermostness’), referring to geographical distance but also to the political relations of a center defining and representing the peripheries. Martinique and Guadeloupe therefore provide an opportunity to analyze distant relationships with Europe and the EU and the re-appropriation of other macro-regional imaginaries as a way for political emancipation, as Caribbean (Giraud, 2004; thesis in progress by Camille Dabestani). Finally, Tunisia and Turkey, as non-member states often represented outside the European geographical area, provide an opportunity to analyze two different relationships with the EU and Europe, but also to project towards macro-regional areas representing developments in geopolitical relations: North Africa, the Mediterranean and Africa on the one hand, and Central Asia, Eurasia and the Middle East on the other, or different evocations of a ‘Global South’ (Rigg, 2007). They reveal the reconfiguration of political relations at the macro-regional level through the prism of popular uprisings in Arab countries, different configurations of coloniality (Tsehaye, Vieille-Grosjean, 2018) and rapid changes in international power and strategic relations.
The public surveyed (Table 1) was targeted so as to obtain, for each country, feedback from students in several disciplines, from institutions of varying status, adapted to each national or territorial context (public and/or private universities or schools, under contract or not) and located in cities of varying sizes5.
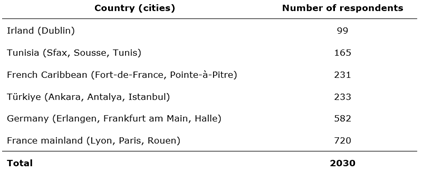
Table 1: Number of Respondents per Surveyed Area
The questionnaire was distributed to thirty-three public and private establishments in the five designated survey countries6 (Table 2). The dissemination carried out through the university networks of the research project members did not result in representative data in each national context, both in terms of geographical areas surveyed in each country and in terms of diversity of existing types of institutions. This was mainly due to the health restrictions linked to the Covid-19 pandemic, which meant that students and teaching colleagues were absent from university campuses, but above all made communication and requests more distant and follow-ups less frequent in a context where future projections remained unclear. In this respect, the aim of this survey was not to achieve representativeness in each context, but above all to obtain as complete and broad overview as possible of the existing perceptions among students.
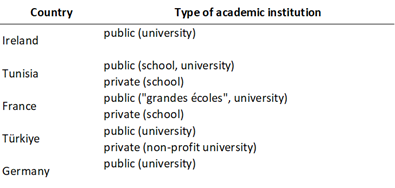
Table 2: Type of academic institutions per Surveyed Area
Six sets of disciplines are targeted, mainly bachelor's and master's students according to the UNESCO classification (UNESCO Institute for Statistics, 2012), which provides a basis for comparability between different university systems. Unfortunately, the disciplinary specialization of the target universities led to a heterogeneous distribution according to the country of study (Table 2).
Although the majority of respondents carried out their studies in their country of origin, 59 different countries of birth were identified. Born between the late 1990s and the early 2000s, the majority of students who took part in the survey were women (60%); the gender gap tended to be higher in some countries7 (Table 3).
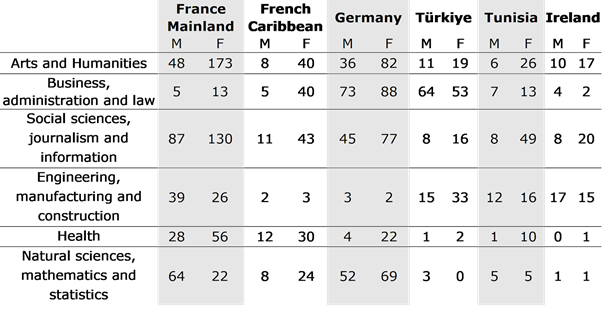
Table 3: Number of Students Surveyed by Country, Discipline and Gender. The answers "Others" or "Do not wish to answer" are not considered in this table.
Thus, three main limitations should be noted concerning the imbalances observed between certain subgroups of the overall sample, whether between countries, between cities or between populations (in terms of discipline or gender). Firstly, the context of the pandemic meant that the questionnaire had to be self-administered, unlike previous projects which were administered during a short class period, for example. This method of data collection implies a selection bias among students, which partly explains the higher participation of students in social sciences and humanities, who are probably more sensitive or used to the purpose of the questionnaire and may influence the perceptions expressed. Although we have not been able to demonstrate the exact biases, we can assume that the disciplinary backgrounds in social sciences and humanities may have an effect on the results. An important factor contributing to this selection bias was the composition of the research team, whose network consists mainly of colleagues teaching in the social sciences and humanities, but also of institutions that are less likely to offer courses in medical sciences or STEM subjects. Distance learning and collaboration in the context of the pandemic have had a significant impact in certain national contexts. It was difficult to follow up with colleagues outside the project, but also with students, to present the survey and its purpose and to discuss it with them. Finally, students in social sciences and humanities may have been more familiar with the subjects surveyed (imaginaries, mobility, linguistic practices, etc.) or the survey methods due to their courses. Despite this, the overview provided by this corpus reveals a wide variety of macro-regional representations and also allows for a rich exploration of modes of objectification.
4. Dissemination Method and Timetable
The questionnaire was distributed to students using their university emails, by the project's members and their networks or using institutions' communications departments.
The survey was distributed over a period of eight months, between November 16, 2021, and June 30, 2022. The controls of the university ethics committees and difficulties encountered during distribution (hardware access, internet connection, absence of a project member on site) led to different collection times between the studied countries. This broad dissemination period is exposed to major national and international events which may have influenced the students' responses. It is worth mentioning in particular the start of the Russian-Ukrainian war in February 2022 or the French presidential elections in April 2022 (Figure 3).
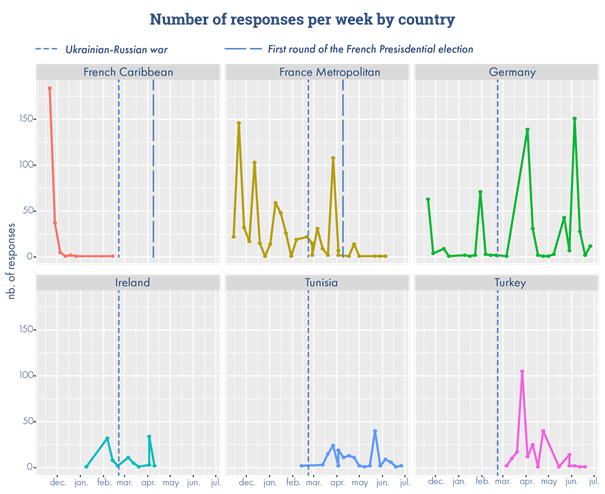
Figure 3: Trend in the Number of Responses to the Questionnaire by Territory and by Week
It is important to emphasize that carrying out a survey in different national contexts required adaptations to the overall structure of the questionnaire for each context, a translation work, as well as different rules and contexts for the survey administration8.
In terms of languages used and translation processes, the questionnaire was first drafted in French. It was then translated into five languages – English, French, German, Darija9 and Turkish – by a member of the project who spoke each of these languages, and checked by all members of the project who spoke those languages. Students could then select the language in which they wanted to view the questionnaire on the first page. We assumed that the display language was the input language, but a check was carried. During the various processing stages and in the database delivered, the open-ended responses were translated into the two pivot languages used for the project, French and English, using the same protocol as for the translation of the questionnaire.
Construction of the Database
The database made available (https://www.nakala.fr/10.34847/nkl.9b2elyum) does not correspond to the raw data collected with the Maptionnaire tool. A series of processing and enrichment operations were carried out (Figure 4).
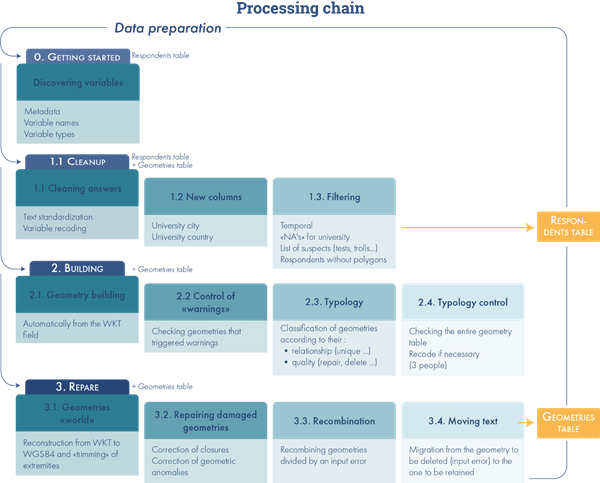
Figure 4: Data processing and enrichment chain, using R
All database manipulations and processing were performed using R and a set of packages for reading and writing data files, manipulating tabular and spatial data, and visualizing data (Table 4).
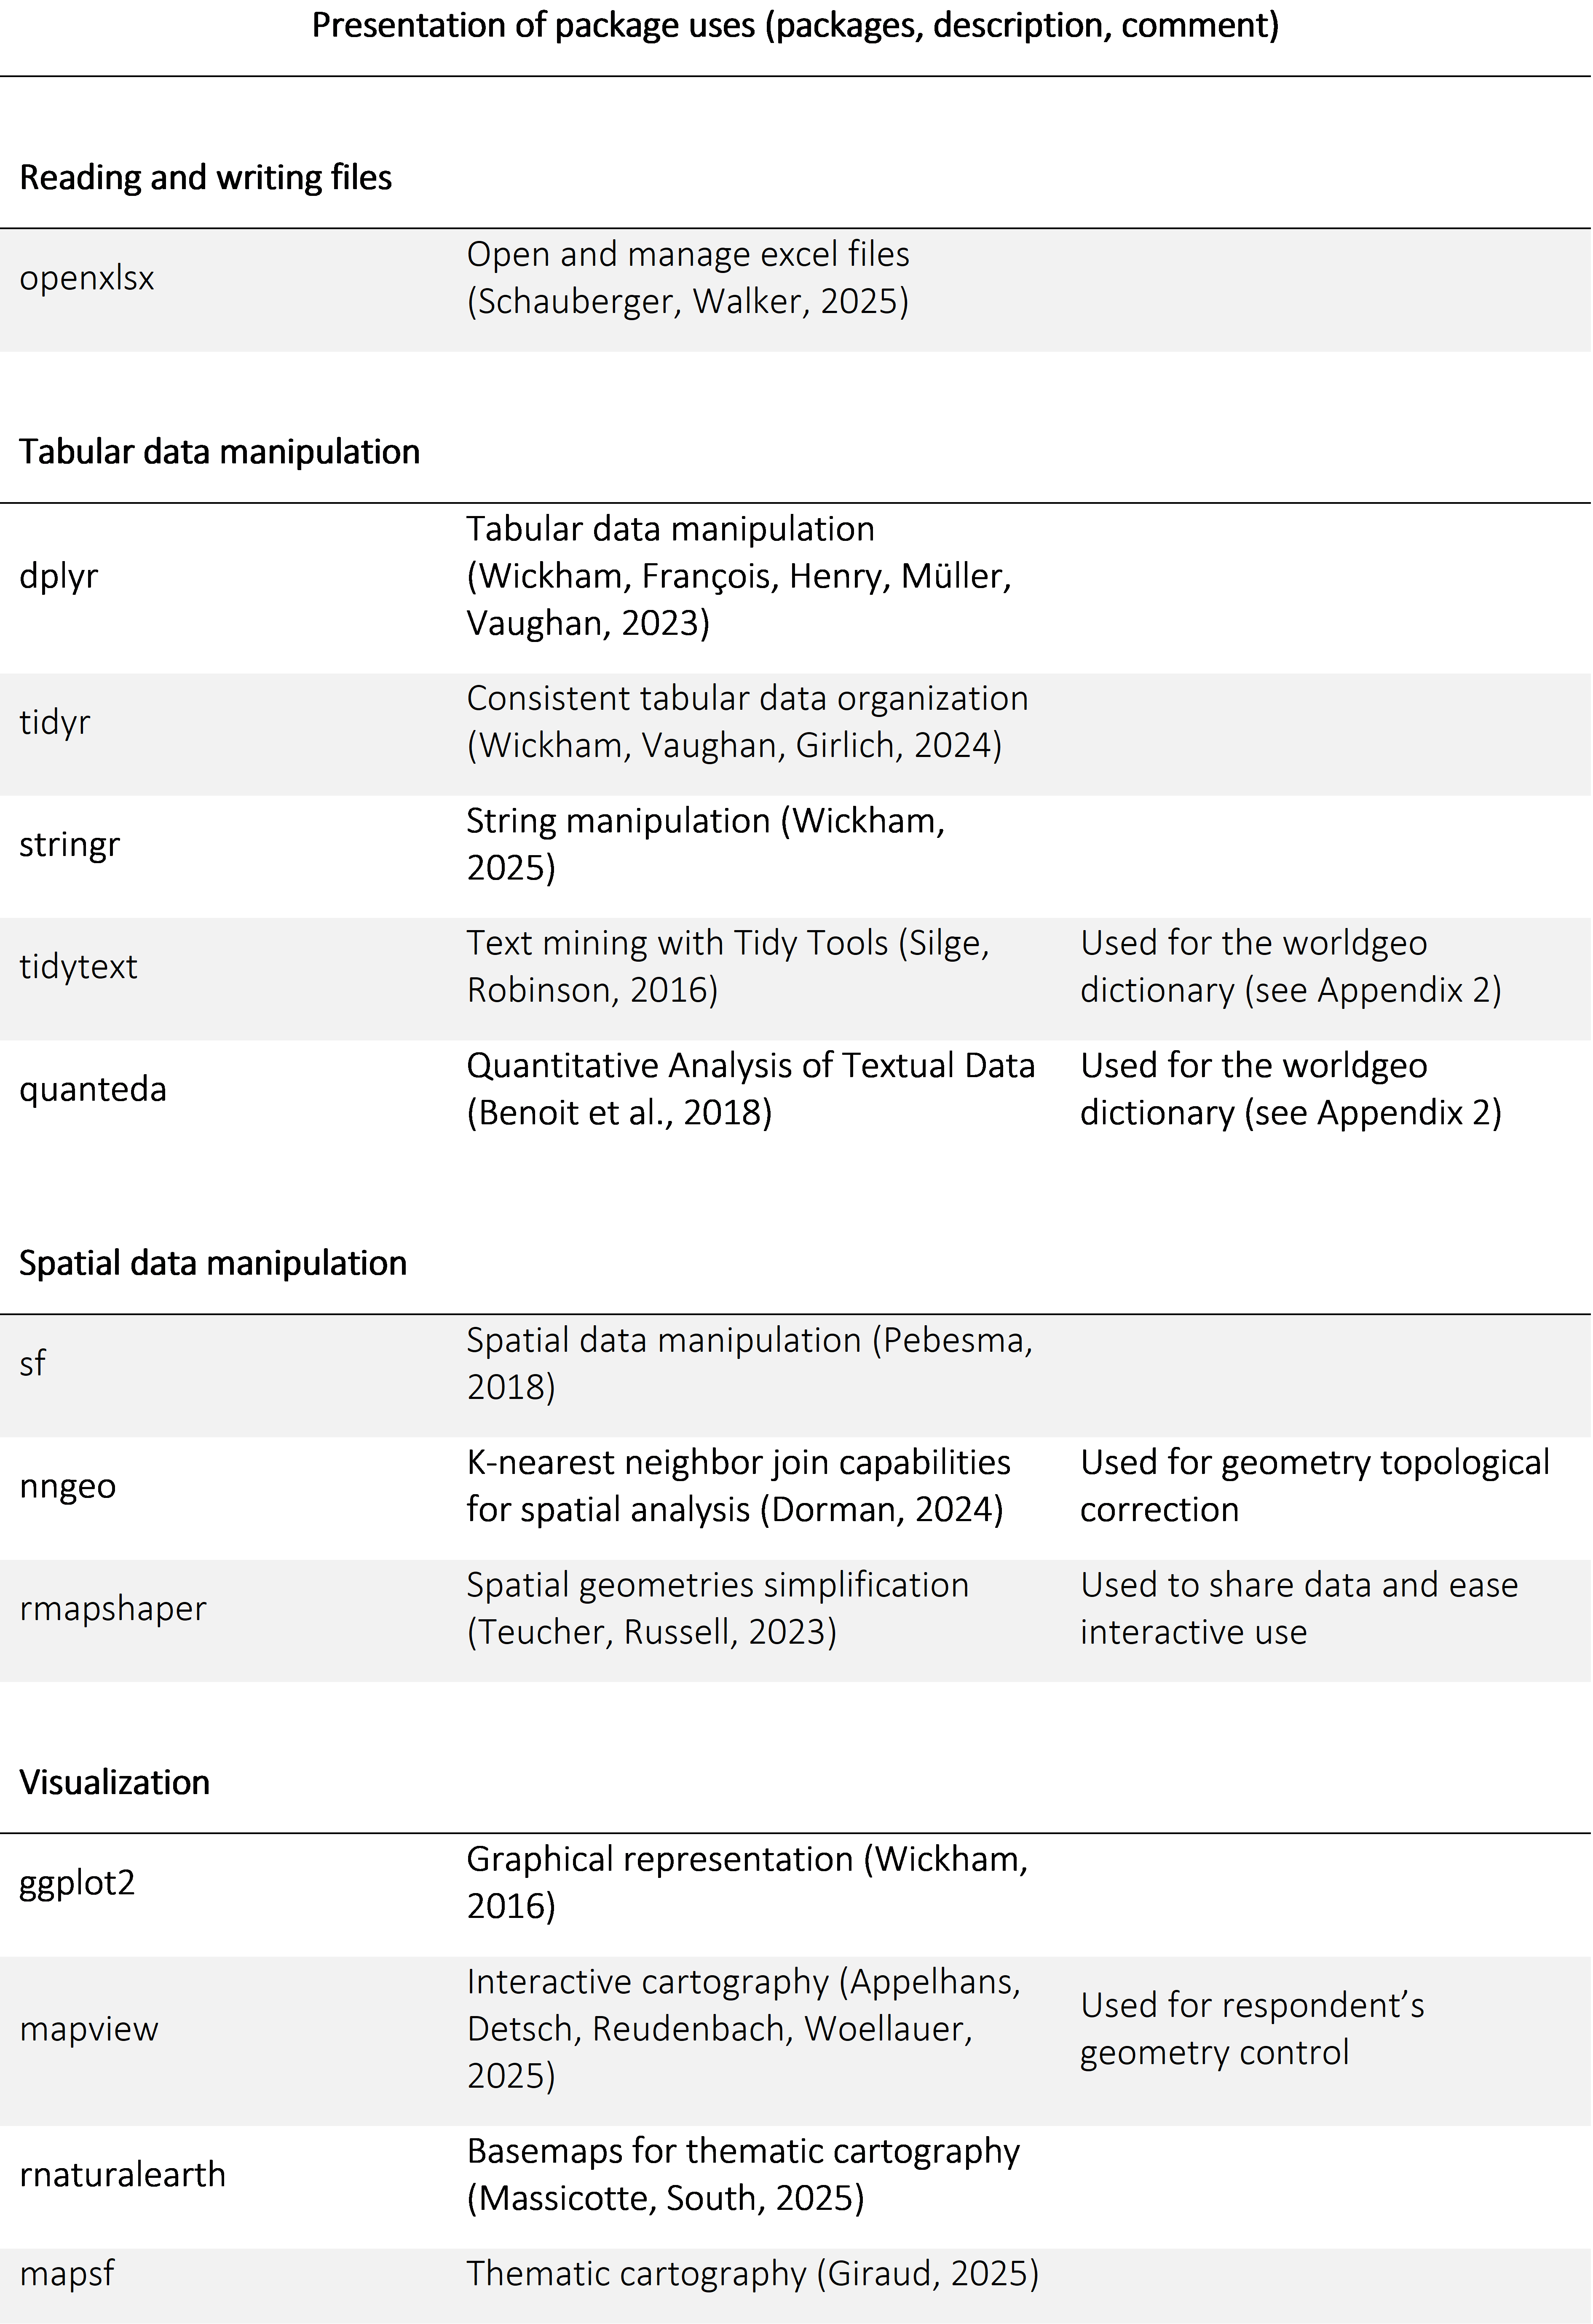
Table 4: Presentation of packages used
Like the raw data collected, the database made available is organized in two files. The first, called the "respondents database", includes all the variables collected, excluding the mental maps. The second, called the "geometries database", only contains the geographical data (mental maps) and associated vocabulary. These two data files have been processed and enhanced as described in the following sections.
1. Processing and Cleaning the Database
We carried out a thorough filtering of respondents. Only responses sent between 16 November 2021 and 30 June 2022, the official survey period, were retained. The various tests carried out during the collection period have been deleted. To enable the database to produce meaningful results, we removed respondents under two conditions: either if the mental map was not completed, or if the background data on the student was not complete enough (university not filled). The purpose of this filtering was to retain data that would allow for the joint analysis of socio-demographic and spatial data. The mental map question served as a reference point in this process, firstly because it was the key exercise in the study of geographical imaginaries in this survey, and secondly because it was located exactly in the middle of the questionnaire, allowing us to gauge the completeness of the data entry. This filtering once again highlighted the impact of unsupervised mental map questioning on the survey's completeness rate. In addition to filtering responses, we corrected several irregularities caused by the data collection tool and its current administration.
This qualitative filtering of the database resulted in the deletion of 1,190 respondents from the final corpus. The final number of respondents in the database used and made available is 2,030 (Figure 5).
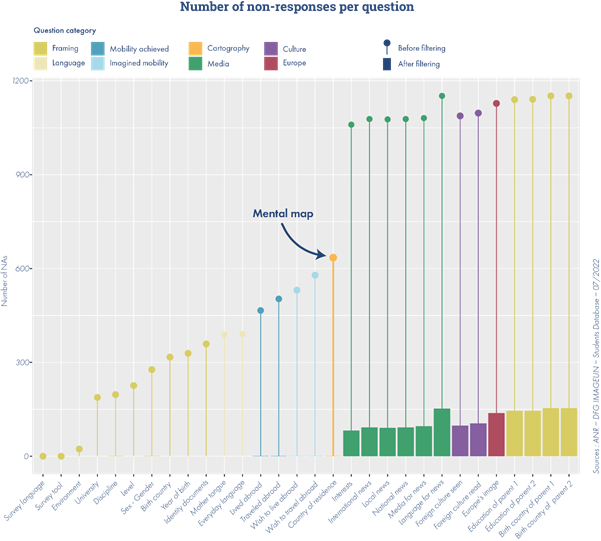
Figure 5: Number of non-responses per question, before and after respondent filtering
Analysis of the deleted responses shows the impact of the device used by students to respond, and in particular the negative effects of participating using a smartphone. Of all the initial responses, more than half of those submitted through smartphone were deleted because they were incomplete (compared to 20% and 25% for responses submitted via computer or tablet). This is the main reason for the imbalance observed between groups by country10: in France and Germany, 60% of deleted respondents used a smartphone, 70% in Ireland and the Caribbean, and over 85% in Tunisia and Turkey11. The two main hypotheses we put forward to explain the negative impact of smartphone input are, on the one hand, the possible difficulty of drawing on a smartphone screen, and on the other hand, compatibility issues between the application and the device and/or its operating system. Indeed, the Maptionnaire application had restrictive optimal operating conditions, requiring a relatively recent device or operating system12. This may have significantly limited responses and led to a socio-economic bias among respondents who participated with smartphone. This bias could have been avoided with a supervised distribution method in an academic setting, which would have allowed respondents to answer on a computer or remedy technical problems.
2. Enhancing the Respondent Database
As a first step, all the categories that correspond to official coding nomenclatures, such as countries (ISO3 code) or languages (ISO 639-3 code, and ISO3 in order to specify a geographical sector) were recoded.
Particular attention was paid to open-ended questions, with the aim of harmonizing the text and spelling in each language of the questionnaire. Open-ended questions requiring country or language names to be entered were recoded using ISO coding standards. If an item entered could not be coded using an existing ISO nomenclature, we harmonized the character string (case, spelling, spaces). Open questions leading to the designation of a regional area with vague boundaries, giving rise to answers that could describe cities, states or economic, cultural or political organizations, were harmonized (for step by step information about recoding, see the website associated with the database).
The open question on words associated with Europe, which was central to the project, was the subject of specific coordination work. We collectively carried out a multilingual recoding of the words cited, followed by a translation into English and French of the 50 most frequent words for each country.
3. Correction and Characterization of the Mental Maps
The file containing the mental maps drawn by the respondents has a different structure to the respondents' database. As respondents can draw up to five zones (each associated with a word or expression), each line in this data file corresponds to a single geometry (a space) drawn, respondent's answers can therefore be stored in several lines.
Maptionnaire can be used to retrieve a faithful drawing of the plots made by the students. Numerous points (nodes) are automatically recorded by the tool during the drawing of an area, which can be done continuously (with one click), or by a succession of clicks, as would be done in a traditional geographic information system. These geometries are then made available in WKT and JSON formats by Maptionnaire. To simplify their use, these geometries have been converted into a geographic layer in geopackage format for distribution.
These georeferenced plots were visually checked and classified (Figure 6) using R semi-automatically. Firstly, the aim was to assess the quality of the drawn polygons (detection of topological problems, input errors, tests, etc.) in order to make a slight geometric correction or delete them from the database. In a second phase, a collective technical and thematic characterization of the drawn polygons was carried out.
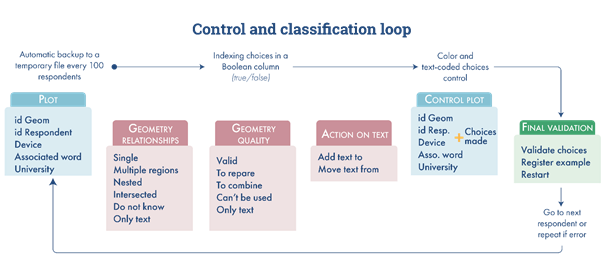
Figure 6: Semi-Automated Loop for Characterizing Geometries, Carried out in R
With a view to spatial analysis and cartographic production, we detected six topological problems (Figure 7) which required correction or reworking of the drawn polygons. The first, which includes three possible cases, is a problem of superimposition and crossing of contours, most often linked to the stage of closing the drawn area. Secondly, a number of polygons resembling scribbles (e.g. input tests), with no associated vocabulary, were detected and removed. The problem of the anti-meridian, a recurrent problem in geomatics (Gadomski, Hartzell, 2025), linked to the use of a cartographic projection, was identified for polygons encompassing the whole world. The topology of these contours has been corrected (for step by step information about geometries characterization, see the website associated with the database).
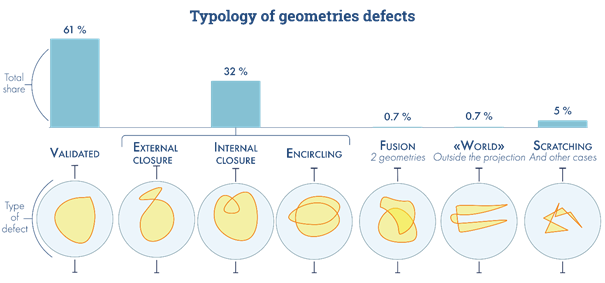
Figure 7: Topological Problems Observed in the Collected Geometries (Drawn Regions)
Finally, polygons that had been drawn separately but designated a single space (sometimes overlapping) were assembled (Figure 8).

Figure 8: Merger of Two Polygons Drawn by the Same Respondent and Characterized only by One Word: "Europe"
In total, 882 polygons underwent minor topological correction, 39 a more specific correction and 142 (5%) were invalidated (scribbles). While these repairs were carried out semi-automatically in R, all the corrections made were the result of collective work and arbitration to ensure that no mental map was distorted. After checking and validating the geometries, the survey collected 2,744 polygons drawn by 2,030 students.
In order to make it easier to use, analyze, and map the mental maps, we created a typology of plots that characterizes the spatial logic of the zones drawn by the same respondent.
We distinguished four types of relationship between the spaces drawn by a single respondent (Figure 9): single region (a polygon), nested region (spaces drawn in a scalar logic), multiple region (disjoint spaces with no intentional spatial overlap), intersecting region (distinct spaces that spatially overlap). Two additional types were added to characterize, on the one hand, responses combining several spatial logics and, on the other hand, responses with one or more polygons presenting an invalid geometry but still associated with a word or expression.
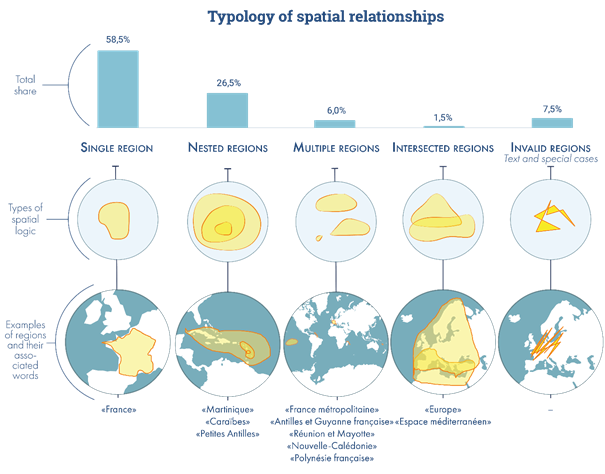
Figure 9: Typologies of Relationships Between the Drawn Regions of the Same Respondent
With a view to aggregated cartographic representations of these mental maps, three weighting values for these classified polygons were implemented in the database (Appendix 3).
4. Typology of Words Associated with Geometry
After each polygon had been drawn, the students were asked to use a word or expression (open question) to describe the area. This associated vocabulary was first corrected and harmonized orthographically in the original language, then translated into the project's two working languages (English and French). A control variable corresponding to the manual identification of the original language was added. In addition to this recoding, we proposed several forms of enrichment in order to categorize the designated spatial objects and to process them independently of the language used (Appendix 2).
The Student Survey database available
Finally, we present the final database delivered on the Nakala platform and the conditions for accessing it. We also review the pseudonymization13 process and the protection of respondents' data and information, which have made this database accessible.
1. Nakala Repository and conditions of access
The database, named "Student survey", is archived in the IR* HumaNum's Nakala data repository: https://www.nakala.fr/10.34847/nkl.9b2elyum.
The entire database and associated metadata (Table 5) are available in a downloadable archive (Marveaux, Dabestani, Pécout, 2024b). The database is split into two files: a text file containing almost all the variables collected, and a geographic layer containing the mental maps and associated vocabulary. Dictionaries of variables associated with these two data files are also made available.
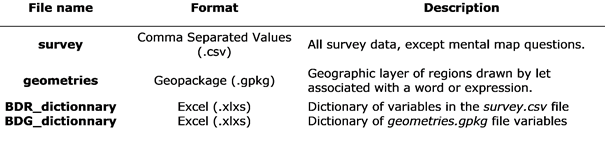
Table 5: "IMAGEUN Student survey" database. Contents of the archive made available on Nakala
The “respondents database” (survey.csv) has a standard survey database structure, where each line corresponds to a respondent. In the geometries database (geometries.gpkg), each line corresponds to a drawn polygon, associated with a word or expression (for example "Europe"). As a result, the different regions drawn (up to five) by the same respondent are stored in several rows.
In order to build a single table containing all the data from the survey, it is necessary to join the two data files provided. The join field to be used is the unique respondent identifier: X0001_met_respID_aut (for detailed information about the database and its files, see the website associated with the database).
In order to promote the openness, collaboration, and re-use of these data within the scientific community and beyond, the database is made available under the Open Database License (OdbL)14 of the Open Knowledge Foundation. Mention of this article may be used as a citation when re-using the database.
Finally, the naming of the columns and the coding of the filled in modalities were simplified and harmonized (Appendix 1) for better intelligibility.
For a detailed description of how to use the database, as well as assistance and tips with statistical analysis and cartographic representation of data, see the website associated with the database.
2. Data management and pseudonymisation
The survey process, the Maptionnaire application and the delivery of data comply with the General Data Protection Regulation (GDPR) imposed by European legislation. The tools used for storing, sharing and making data available have been chosen to comply with the GDPR framework (tools provided by IR* Human-Num: Sharedocs, Nakala, and GitLab).
We have ensured the anonymity of the students who participated in the survey through several processes on the delivered database. As mentioned above, several survey constraints resulted in some subgroups being small. In these cases, we either generalized or removed certain variables whose rare characteristics resulted in unique or very small subgroups. Thus, universities were generalized at the level of the survey cities, and ages were grouped into several categories corresponding theoretically to the main stages of a European bachelor's-master's-doctorate program and compatible with the Turkish and Tunisian university systems (18 to 21 years old, 22 to 25 years old, over 25 years old).
For several variables, modalities with few occurrences (e.g. country of birth, nationality, discipline…) were recoded and grouped together. For example, country names were sometimes recoded as booleans (TRUE for countries surveyed, FALSE for others).
Finally, comments, email addresses provided by students who agreed to be contacted for an interview, and IP addresses were also deleted.
Conclusion: Feedbacks on Methodological Limits and Contributions
The central objective of this study was to analyze the construction of macro-regional imaginaries through student practices and representations. One of the specific features of this study, in terms of its methodology, is that it uses numeric mental maps to understand geographical imaginaries. The aim is to analyze the diverse, multiple and interacting spatial entities that make sense to students.
The use of an interactive mapping tool made it possible to collect eclectic mental maps with varied coverage. The regions of the world delineated vary in nature, scale and number according to the responses, and involve varied and complex links between the spaces mapped out. To preserve the plurality and richness of the responses, the semi-automatic processing of polygons and cartographic representation are key stages in this project. Similarly, the work carried out to enrich (categorize and weight) the plotted areas facilitate the analysis. The names associated with the zones drawn by the students have also been topologized to enable various quantitative semantic analysis.
The detailed mapping method, applied in R language, makes it possible to summarize the macro-regional imaginaries of a group of students, whether to express a sense of overall belonging to a territory (Figure 10) or to highlight the prevalence of imagined boundaries of a clearly designated space (Figure 11).
The objective of this protocol is to understand students' perceptions of macro-regional imaginaries and associated identities. More specifically, the survey conducted among this audience aims, on the one hand, to understand the perception of macro-regional imaginaries through lived experiences by asking questions about representations and practices of mobility, language and media. The aim is therefore to consider geographical imaginaries (in this case, macro-regional) in a bottom-up manner, through the actors who inhabit these spaces in their daily lives. Secondly, this survey contributes to reflections on the objectification of representations of vague and subjective objects through mental or sensitive maps. Beyond the reuse of data, what is permitted here is the reuse or enrichment of the methodology developed around numeric mental maps, whether for the collection and processing of geometries or for the cartographic representation of the geographical objects obtained. The difficulties encountered during dissemination due to this numeric format, the mental mapping exercise, and the unsupervised dissemination mode chosen in response to the pandemic context made it possible to identify and question the limitations and possible solutions for future projects focusing on mental representations of geographical objects at all scales.
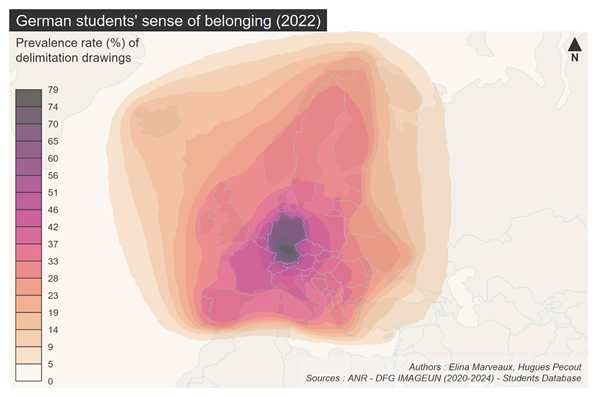
Figure 10: Aggregate Map of the Sense of Belonging to a Territory, According to Students in Germany, Resulting from the Combination of 779 Regions Drawn by 568 Students
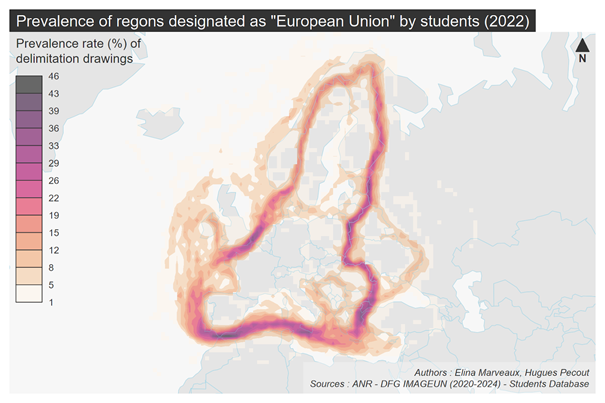
Figure 11: Aggregate Map of the Boundaries of the Regions Designated as the "European Union", i.e. 84 Students' Mental Maps
Finally, this database has been the subject of both thematic and methodological work by the authors of this paper. Thematically, this survey opens up new perspectives for questioning and analyzing macro-regional imaginaries and forms of expression in the various contexts examined. In particular, they make it possible to examine the pluralistic relationships, challenges and re-appropriations of institutional narratives (European, national, ideological, etc.) produced on identities ‘from below’ by individuals and collectives (Ripoll, Veschambre, 2006). Camille Dabestani's doctoral thesis (in progress) uses a corpus of mental maps created by students in Martinique and Guadeloupe to analyze macro-regional imaginaries and the expression of identities based on these objects. Mental maps thus make it possible to study these imaginaries in an objective manner, and the questionnaire survey is articulated in a methodological framework with semi-structured interviews using these mental maps. The approach based on experiences and subjectivities has thus made it possible to question the expressions and appropriations of the macroregional imaginaries of students in Guadeloupe and Martinique. It was possible to analyze projections towards the Caribbean as a means of emancipation from the power relations and marginalization produced by the postcolonial context relating to France, Europe and the EU (Dabestani, 2024).
Methodologically, this database informs thinking on the processing, synthetic representation, and cartographic analysis of mental maps by addressing ambiguity as well as complex and articulated representations (spatial logics) (Dabestani, 2005), at both macro and local scales and using qualitative collection methods (Marveaux et al., 2024a; article in progress). In terms of data visualization in particular, the database has been used to create an interactive atlas presenting summaries of the main results of the project, particularly the student survey, as well as widgets that allow users to visualize, among other things, the semantic dimensions of mental maps and the mobility spaces realized and projected by students (Marveaux, 2024).
Acknowledgment
This work is part of the Franco-German ANR-DFG IMAGEUN research project "In the Mirror of the European Neighbourhood (Policy): Mapping Macro-Regional Imaginaries" (2020-2024), supported by the French Agence nationale de la recherche (ANR-19-FRAL-011: https://anr.fr/Projet-ANR-19-FRAL-0011) and the Deutsche Forschungsgemeinschaft (DFG).
Many thanks to Etienne Toureille for his fundamental contributions to the construction, processing and presentation of this database. We would also like to thank the entire team working on the student survey, especially Sophie de Ruffray and Clarisse Didelon-Loiseau, as well as Veit Bachmann and Claude Grasland, who were responsible for this ANR-DFG project. We would like to thank Clarisse Didelon-Loiseau and Mégane Fernandez for their advice and proofreading at the various stages of writing this article, and finally Marion Gentilhomme for her help with translation work.
References
Alves Brasil, J., & Cabecinhas, R. (2019). (Dis)covering the Latin American “Other”: Social (meta)representations of Latin Americans among Brazilians, Chileans and Mexicans. Papers on Social Representations, 28(2), 1–31.
Anderson, B. (1983). Imagined communities: Reflections on the origin and spread of nationalism. Verso.
Aouani, S., Orange, S., & Renard, F. (2019). Les ressources de la proximité. Capital d’autochtonie et engagements locaux des jeunes femmes d’origine populaire et rurale. Revue française des affaires sociales, 2, 167–189.
Appelhans, T., Detsch, F., Reudenbach, C., & Woellauer, S. (2025). mapview: Interactive viewing of spatial data in R. https://CRAN.R-project.org/package=mapview
Avanza, M., & Laferté, G. (2005). Dépasser la « construction des identités » ? Identification, image sociale, appartenance. Genèses, 61(4), 134–152.
Bachmann, V. (2015). Global Europa, ESPON and the EU’s regulated spaces of interaction. Journal of European Integration, 37(6), 685–703.
Ballatore, M., & Blöss, T. (2008). L’autre réalité du programme Erasmus : affinité sélective entre établissements et reproduction sociale des étudiants. Formation emploi, 103(3), 57–74.
Battersby, S. E., & Montello, D. R. (2009). Area estimation of world regions and the projection of the global-scale cognitive map. Annals of the Association of American Geographers, 99, 273–291.
Beauguitte, L., Didelon, C., & Grasland, C. (2012). Le projet EuroBroadMap : Visions de l’Europe dans le monde. Politique européenne, 37(2), 156–167.
Benoit, K., Watanabe, K., Wang, H., Nulty, P., Obeng, A., Müller, S., et al. (2018). Quanteda: An R package for the quantitative analysis of textual data. Journal of Open Source Software, 3(30), 774.
Blais, H. (2009). Coloniser l’espace : territoires, identités, spatialité. Genèses, 74(1), 145–159.
Brennetot, A., Emsellem, K., Guérin-Pace, F., & Garnier, B. (2013). Dire l’Europe à travers le monde : Les mots des étudiants dans l’enquête EuroBroadMap. Cybergeo. http://journals.openedition.org/cybergeo/25684
Bronner, A.-C. (2018). Représentations et pratiques : des liens à questionner, des dimensions individuelles et collectives à articuler. In Colloque Cartotête : Représentations socio-cognitives de l’espace géographique (pp. 50–57). Clermont-Ferrand, France.
Brubaker, R. (2001). Au-delà de l’« identité ». Actes de la recherche en sciences sociales, 139(4), 66–85.
Cauvin, C. (1999). Pour une approche de la cognition spatiale intra-urbaine. Cybergeo. http://journals.openedition.org/cybergeo/5043
Dabestani, C. (2024). (Re)penser l’Union européenne depuis la Caraïbe : imaginaires, identités et projections des étudiant·es en Guadeloupe et en Martinique. L’Espace politique. https://journals.openedition.org/espacepolitique/13320
Dabestani, C. (2005). Refaire la Caraïbe : Représentations et appropriations étudiantes des imaginaires macrorégionaux en contexte postcolonial (Guadeloupe, Martinique) (Thèse de doctorat, Université Paris 1 Panthéon-Sorbonne). Université Paris 1 Panthéon-Sorbonne.
De Ruffray, S. (2007). L’imprécision et l’incertitude en géographie : L’apport de la logique floue aux problématiques de régionalisation (Mémoire d’habilitation à diriger des recherches). Université Paris 7 Diderot.
Dernat, S., Bronner, A.-C., Depeau, S., Dias, P., Lardon, S., & Ramadier, T. (2018). Représentations socio-cognitives de l’espace géographique. In Colloque Cartotête : Représentations socio-cognitives de l’espace géographique. Clermont-Ferrand.
Dias, P., & Ramadier, T. (2017). Relations sociales et cartographie cognitive : Les points de référence comme noyau central des représentations spatiales. Presses universitaires de Liège, 116, 319–349.
Didelon, C. (2010). Une vision de l’Europe : le tracé de l’Europe des chercheurs impliqués dans ESPON. Annales de géographie, 673(3), 211–228.
Didelon, C., De Ruffray, S., Boquet, M., & Lambert, N. (2011). Un monde d’interstices : Apport de la logique floue pour l’analyse des cartes interprétatives. Comité français de cartographie, 209, 71–82.
Didelon-Loiseau, C., Emsellem, K., & De Ruffray, S. (2019). Apport des cartes mentales dans l’analyse des sentiments d’appartenance à l’Union européenne. In Prolifération des territoires et représentations territoriales de l’Union européenne (pp. 141–159). Les dossiers des Annales de droit.
Dorman, M. (2024). nngeo: k-nearest neighbor join for spatial data. https://CRAN.R-project.org/package=nngeo
Escudé-Joffres, C. (2025). Une géopolitique de la (dé)construction institutionnelle en Arctique : régionalisation et représentations concurrentes. Hérodote, 197(2), 65–80.
Frouillou, L., & Moulin, L. (2019). Les trajectoires socialement et spatialement différenciées des étudiants franciliens. Formation emploi, 145(1), 7–28.
Gadomski, P., & Hartzell, P. (2025). Antimeridian: A Python package for correcting geometries that cross the 180th meridian. Journal of Open Source Software, 10(105), 753. https://joss.theoj.org/papers/10.21105/joss.07530
Gilmartin, M. (2008). Migration, identity and belonging. Geography Compass, 2(6), 1837–1852.
Giraud, M. (2004). Faire la Caraïbe, comme on refait le monde. Pouvoirs dans la Caraïbe, 14, 81–108. http://journals.openedition.org/plc/252
Giraud, T. (2023). mapiso: Create contour polygons from regular grids. https://CRAN.R-project.org/package=mapiso
Giraud, T. (2025). mapsf: Thematic cartography. https://hal.science/hal-05028850v1
Gould, P., & White, R. (1974). Mental maps. Harper & Row.
Grasland, C., Didelon-Loiseau, C., Brennetot, A., Pécout, H., Pistre, P., De Ruffray, S., et al. (2019). Premiers résultats de l’enquête GlocalMap : La perception des échelles territoriales de l’action publique en France. Les dossiers du CIST, 7.
Hirschhausen, B. von. (2023). Les provinces du temps : frontières fantômes et expériences de l’histoire. Éditions du CNRS.
Kahila, M., & Kyttä, M. (2009). SoftGIS as a bridge-builder in collaborative urban planning. In Planning Support System Best Practice and New Methods (pp. 389–411).
Lemetre, C., & Orange, S. (2016). Les ambitions scolaires et sociales des lycéens ruraux. Savoir/Agir, 37(3), 63–69.
Lynch, K. (1960). The image of the city. MIT Press.
Mareï, N., & Richard, Y. (2020). Régionalisations du monde et intégration (macro)régionale : pour une montée en généralité géographique. Belgeo. http://journals.openedition.org/belgeo/43451
Marveaux, E. (2024). Cartographier les imaginaires macrorégionaux. Atlas Interactif IMAGEUN. https://elinamx.github.io/atlas-imageun/
Marveaux, E., Dabestani, C., & Pécout, H. (2024a). Étudier les imaginaires macrorégionaux estudiantins : base de données et traitements. IMAGEUN Data Paper. https://imageun.gitpages.huma-num.fr/datapaper/fr/index.fr.html
Marveaux, E., Dabestani, C., & Pécout, H. (2024b). IMAGEUN – Enquête étudiante / IMAGEUN – Student Survey (Version 2). Nakala–CNRS. https://nakala.fr/10.34847/nkl.9b2elyum
Massicotte, P., & South, A. (2025). rnaturalearth: World map data from Natural Earth. https://CRAN.R-project.org/package=rnaturalearth
Murphy, A. B. (2013). Advancing geographical understanding : Why engaging grand regional narratives matters. Dialogues in Human Geography, 3(2), 131–149.
Paasi, A. (2010). Regions are social constructs, but who or what “constructs” them? Environment and Planning A: Economy and Space, 42(10), 2296–2301.
Pebesma, E. (2018). Simple features for R: Standardized support for spatial vector data. The R Journal, 10(1), 439–446.
Pinheiro, J. Q. (1998). Determinants of cognitive maps of the world as expressed in sketch maps. Journal of Environmental Psychology, 18, 321–339.
Quesnot, T. (2024). Approches (dés)incarnées des espaces-temps en Océanie (HDR). Université de Bretagne Occidentale.
Rigg, J. (2007). An everyday geography of the global South. Routledge.
Ripoll, F., & Veschambre, V. (2006). L’appropriation de l’espace : une problématique centrale pour la géographie sociale. In Penser et faire la géographie sociale (pp. 295–304). Presses universitaires de Rennes.
Rouland, B., & Toureille, E. (2021). In the Mirror of the European Neighbourhood (Policy): Mapping macro-regional imaginations (IMAGEUN). Lettre de l’IRMC, 29. https://irmc.hypotheses.org/2631
Saarinen, T. F. (1988). Advantages and disadvantages of using sketch maps to explore images of the world. 26th Congress of the International Geographic Union, Sydney.
Schauberger, P., & Walker, A. (2025). openxlsx: Read, write and edit xlsx files. https://CRAN.R-project.org/package=openxlsx
Silge, J., & Robinson, D. (2016). tidytext: Text mining and analysis using tidy data principles in R. Journal of Open Source Software, 1(3). http://dx.doi.org/10.21105/joss.00037
Sudas, I., & Gotken, C. (2012). Cognitive maps of Europe: Geographical knowledge of Turkish geography students. European Journal of Geography, 3(1), 41–56.
Teucher, A., & Russell, K. (2023). rmapshaper: Client for "mapshaper" for "geospatial" operations. https://CRAN.R-project.org/package=rmapshaper
Toureille, E. (2016). Cartes mentales et autres techniques projectives visuelles. In Les outils qualitatifs en géographie (pp. 117–141). Armand Colin.
Toureille, E. (2017). La Turquie en Europe, la Turquie dans le monde : analyse d’une catégorie macro-régionale au regard d’une géographie des représentations. Université Paris Diderot.
Tsehayé, R. S., & Vieille-Grosjean, H. (2018). Colonialité et occidentalocentrisme : quels enjeux pour la production de savoirs ? Recherches en éducation, 32. https://journals.openedition.org/ree/2323
UNESCO Institute for Statistics. (2012). International standard classification of education: ISCED 2011. UNESCO Institute for Statistics.
Wickham, H. (2016). ggplot2: Elegant graphics for data analysis. Springer. https://ggplot2.tidyverse.org
Wickham, H. (2025). stringr: Simple, consistent wrappers for common string operations. https://CRAN.R-project.org/package=stringr
Wickham, H., François, R., Henry, L., Müller, K., & Vaughan, D. (2023). dplyr: A grammar of data manipulation. https://CRAN.R-project.org/package=dplyr
Wickham, H., Vaughan, D., & Girlich, M. (2024). tidyr: Tidy messy data. https://CRAN.R-project.org/package=tidyr
Appendices
Appendix 1: Variable Coding Method
All the variables were renamed with a character string constructed as follows:
-
A letter for the theme (according to the order of the questionnaire) – e.g. A
-
A two-digit number for the page number of the questionnaire – e.g. 03
-
A two-digit number for the question number on the page – e.g. 02
-
Three letters to explain the themed category – e.g. cad (for framing [cadrage] questions)
-
Six characters for the unique identifier of the question – e.g. medium (question on the device used)
-
Three characters for the type of value (modality) entered in the database – e.g. opt
-
Two or more characters for the input language or the described modality – e.g. en or e.g. computer
For example, the device used to answer the survey ("What type of technical medium are you using to complete this questionnaire?") is entered in English in the column named A0302_cad_medium_lab_en.
Underscores ("_") have been used to simplify the reading. A dictionary of variables supplied with the database is used to map survey questions to variables (codenames) in the database.
2. Appendix 2: Detection of Named Geographical Entities
Some enrichment variables were entered manually, to enable semantic grouping of the cited objects:
-
Grouping by "concept": This variable links different phrases to the same entity ("French Republic" and "France", for example, refer to the same entity: France).
-
Grouping by "scale": This variable categorizes entities according to their scale (macro-regional, national, local, for example). This typology makes it possible to differentiate between objects that can be assimilated to macro-regions and other objects. It is important to note that not all identified objects have a scale.
-
Grouping by "type": A second variable was needed to identify the type of object identified (city, political organization, urban region, continent, sub-continent, etc.). In fact, two objects both located at similar scales (macro-region): "Europe" and "EU", for example, are categorized in different types ("continent" in the first case and "political organization" in the second).
-
Grouping by "parent": This variable is used to make ontological groupings of objects linked by a scale relationship. For example, the term "Western Europe" is a parent of the term "Europe". In practical terms, this variable allows you to work at different levels of granularity.
Two additional variables also indicate entities for which semantic or linguistic ambiguity is possible.
3. Appendix 3: Weighting of Geometries in Responses to Mental Maps
Three weighting values were established for each polygon drawn by the students:
-
weight_geom: Each polygon drawn has a weight of 1
-
weight_resp: Each respondent has a weight of 1 (weight of each polygon = 1 / number of polygons entered by the respondent)
-
weight_scale: Each respondent has a weight of 1 and nested geometries have a shared weight (total weight of several nested polygons = 1)
These different weightings can then be considered in the construction of aggregated maps (Figure 12).
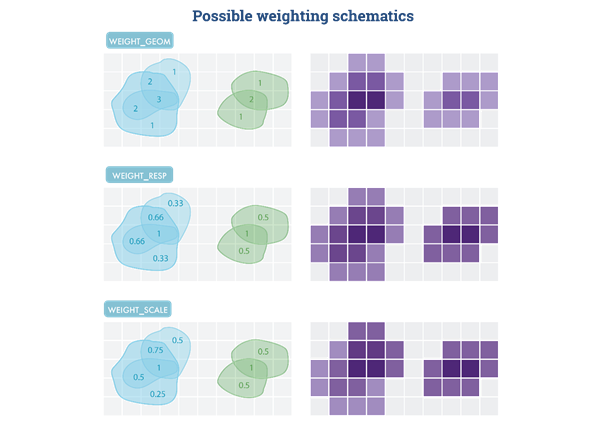
Figure 12: Use of Weighting Variables to Construct Aggregated Maps on a Regular Grid
Notes
1Maptionnaire application website [https://www.maptionnaire.com/]
2OpenStreetMap (OSM) is a collaborative online mapping project, inspired by the success of Wikipedia, which aimsto create a global geographic database, enabling the creation of free-licensed maps, for example.
3 Documentation from the French Ministry of Culture's survey on cultural practices [https://www.culture.gouv.fr/espace-documentation/statistiques-ministerielles-de-la-culture2/l-enquete-pratiques-culturelles]
4 The EU's outermost regions (ORs) are nine regions that are full members of the EU and are characterized by their “outermost” location (particularly due to their distance from the former colonial powers with which they are associated): Guadeloupe, French Guiana, Martinique, Mayotte, Réunion, Saint Martin (France), the Canary Islands (Spain), the Azores, and Madeira (Portugal). They are distinct from the EU's OCTs (Overseas Countries and Territories), which are thirteen regions associated with the EU (not members): New Caledonia, Polynesia, Saint-Pierre and Miquelon, French Southern and Antarctic Lands, Wallis and Futuna, Saint Barthelemy (France), Greenland (Denmark), Aruba, Bonaire, Curaçao, Saba, Saint Eustatius, and Sint Maarten (Netherlands).
5 The surveyed universities are located in 15 cities. Each city is considered as a university cluster, including the universities associated with the same urban area. For example, universities in the Tunis urban area, such as La Manouba, are grouped together in the “Tunis” cluster in the table. These university clusters make it easier to present the data and the survey, but each cluster may contain a variety of university contexts.
6 The detailed list is available on the data handling website associated with the survey database.
7 In terms of gender, the Tunisian and Caribbean cases stand out for the significantly higher participation of female students. For example, in the Martinique and Guadeloupe surveys, female students accounted for 80% of participants. This high proportion is similar to their university of enrolment, although higher (67% of women studying at the Université des Antilles in 2021/22, DataESR).
8 For example, sensitivity to questions relating to national minorities and gender in some national contexts have to be considered to avoid exposing project partners to political difficulties during ethics committee. With regard to the question on gender in the questionnaire, the aim is to understand the influence of gendered socialization on representations of regions of the world. The aim is to produce an inclusive questionnaire. The wording chosen is deliberately vague “You are:” implying gender or sex for contexts where the question would create tension or risk during dissemination. The modalities “other” and “do not wish to answer” are also not included in the Turkish translation to avoid rejection by university ethics committees.
9 Vernacular languages derived from Arabic, spoken in Tunisia, Morocco, and Algeria.
10 The gender, field of study, and enrollment level of the filtered individuals are broadly proportional to the entire sample collected. Only respondents enrolled in doctoral programs were removed in greater numbers, mainly corresponding to project members and dissemination partners who had tested the questionnaire beforehand and who were pre-identified and removed from the final sample.
11 This discrepancy can be seen in the responses deleted by country surveyed: around 20% of responses were deleted for the German, French (mainland and Caribbean) and Irish samples, compared with around half for the Tunisian and Turkish samples.
12 Regarding the compatibility of the application and the media used, Maptionnaire stated on its website: "Maptionnaire uses commercially reasonable efforts to support the two most recent major versions of operating systems with significant market share running up-to-date versions of browsers with significant market share. As of November 9, 2021, the supported operating systems and versions for respondents are: - Windows (11, 10) - macOS (12, 11) - Android (12, 11) – iOS/iPadOS (15, 14). The supported browsers are Chrome, Safari, Firefox, Samsung Internet, Edge, and Opera. For optimal performance, please remember to make sure that you have the latest browser version. If you are part of a team using Maptionnaire to create questionnaires and other content, we recommend that you use the latest version of Chrome. (Excerpt from the Maptionnaire website, accessed in June 2022).
13 According to the CNIL, pseudonymization refers to data processing aimed at making it impossible to identify individuals, but unlike anonymization, it is a reversible operation if additional data is provided by the database producers (CNIL, 2022, [https://www.cnil.fr/fr/recherche-scientifique-hors-sante-enjeux-et-avantages-de-lanonymisation-et-de-la-pseudonymisation]). In our case, the identity of individuals cannot be revealed as a result of the collection, however, additional information to that provided in the database delivered would make individuals in certain subgroups potentially identifiable.
14 Presentation of the OdbL licence [https://opendata.onisep.fr/licence/licence-odbl/48-licence-odbl.htm]


 Télécharger l'article

 Contacter l'auteur
 Tous les articles